Simulation of Batch and Continuous Processes
SuperPro Designer (as well as its subset, EnviroPro) is the only commercial process simulator that can handle equally well continuous and batch processes as well as combinations of batch and continuous. The Full as well as the Evaluation and Demo versions of SuperPro are shipped with several examples of both kinds. For instance, there are several environmental examples (that deal that with wastewater treatment, purification, and recycling) that are continuous processes with multiple nested recycle loops. The biotech and pharmaceutical examples, on the other hand, deal with batch processes, which is the dominant mode of operation in those industries.
Graphical Interface
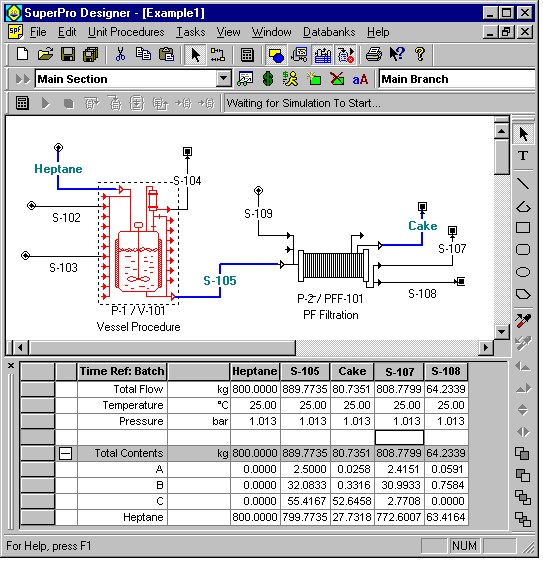
All of our tools feature intuitive and user friendly interfaces that speak the language of process engineers. The user models a process by developing a flow diagram (see figure below). The equipment-looking icons represent unit operations for continuous processes and unit procedures for batch processes.
Despite the many new features and capabilities in version 4.7, all members of the Pro-Designer family (BatchPro, BioPro, EnviroPro, and SuperPro) have maintained their intuitive and user friendly interface (see figure below). In this environment, developing a process flowsheet or modifying values is as easy as point�and�click. The interface is very similar to other MS Windows applications, making its features very intuitive.
Unit Procedures
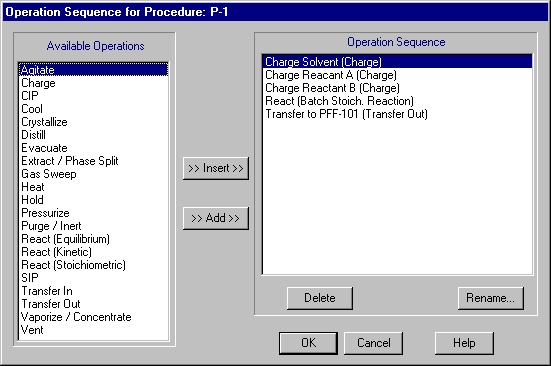
A Unit Procedure is a set of operations that take place sequentially in a piece of equipment. For instance, the P-1 vessel unit procedure (see figure above) includes the following operations: Charge Solvent, Charge Reactant A, Charge Reactant B, Transfer to PFF-101 (see figure below). The concept of unit procedures enables the user to model batch processes in great detail. A unit procedure is represented with a single equipment-looking icon on the screen. Multiple procedures can share the same equipment item as long as their cycle times do not overlap.
Unit Procedures in Continuous Processes � If you deal with continuous processing steps in continuous flowsheets, then unit procedures behave like unit operations. In such situations, all interface features that are reminiscent of unit procedures (e.g., the "Add/Remove Operations" dialog and the Scheduling tab) are hidden so that unit procedures can be truly perceived as unit operations by the user.
Operations
For every operation within a unit procedure, the simulator includes a mathematical model that performs material and energy balance calculations. Based on the material balances, it performs equipment-sizing calculations. If multiple operations within a unit procedure dictate different sizes for a certain piece of equipment, the software reconciles the different demands and selects an equipment size that is appropriate for all operations. In other words, the equipment is sized so that it is large enough that it will not be overfilled during any operation, but it is no larger than necessary (in order to minimize capital costs). In addition, the software checks to ensure that the vessel contents will not fall below a user-specified minimum volume (e.g., a minimum stir volume) for applicable operations.
The initialization of operations is done through appropriate dialog windows. For instance, the figure below shows the Oper.Cond's tab of a charge operation. Through this the user specifies either the process time (duration) of the operation or the charge rate (based on mass or volumetric flowrate) and the program uses that information to calculate the duration. A third option is to the set the duration of an operation equal to the duration of another operation or equal to the sum of durations of some other operations (through the "Set by Master-Slave Relationship" interface). The Emissions tab is used to specify parameters that affect emissions of volatile organic compounds (VOCs). The Labor tab is used to specify the labor requirement for this operation. The Description tab displays a description of the process generated by the model (e.g., Charge 1000 L of Water at a rate of 150 L/min using stream Water-A). The user has the flexibility to edit the description and enter his/her own comments for documentation purposes. The Scheduling tab is used for specifying the Start Time of this operation relative to other events (e.g., the beginning of the batch, the beginning or end of some other operation in the same or a different procedure, etc.).
SuperPro Designer includes more that 120 operation models. The available operations are listed on the
SuperPro page. Visit the
EnviroPro page to see the list of operations in EnviroPro Designer.

Component and Mixture Databases
The registration of pure components and mixtures is something that typically precedes the initialization of operations. SuperPro is equipped with two component databases, its own of 600 compounds and a version of DIPPR that includes 1,700 compounds (the DIPPR database must be purchased separately from Brigham Young University of Utah). It also comes with a user database where modified and newly created compounds can be saved. All database files are in MS Access format. Furthermore, SuperPro comes with mixture databases to represent buffers and other solutions that are commonly used in the biotech and other industries. Again, the user has the option to create his/her mixtures and save them in the user database.
For each pure component, the SuperPro databank includes thermodynamic (e.g., molecular weight, critical pressure and temperature, accentric factor, vapor pressure, density, specific heat, particle size, etc.), environmental (e.g., biodegradation data, octanol to water distribution ratio, Henry�s law constant, component contribution to TOC, COD, BOD5, TSS, etc.), cost (e.g., purchasing price, selling price, etc.) and regulatory (e.g., type of pollutant) data.
Scheduling of Batch Operations
Gantt Charts. SuperPro generates Gantt and Equipment Utilization charts that enable users to visualize the scheduling and execution of batch operations. The figure below displays the Gantt chart of our simple, two-step process (reaction in a vessel and filtration). The look and feel of our Gantt chart is quite similar to that of MS Project. The chart is highly customizable. The user has the option to expand or collapse the view of each unit procedure, cycle, section, etc. The user may also change the colors of the chart bars, remove the labels by the chart bars, and change the scale of the chart.
Furthermore, the Gantt chart interface provides access to all simulation data for every operation in every procedure (that is included in the scheduling), thereby making it very easy to modify some operating condition and re-compute the execution plan. SuperPro Designer will resolve M&E balances, re-compute the scheduling periods for all operations and redraw the Gantt chart all in a click of a button. This is extremely important as it allows the user to visualize and refine a recipe on either the flowsheet (main) interface or the scheduling interface.

SuperPro also supports exporting of scheduling data (for single and multiple batches) to MS Project. The figure below shows the Gantt chart of our simple, two-step process imported into MS Project. SuperPro scheduling links among operations (scheduling dependencies) are retained in MS Project. Equipment, labor, energy and material resources are automatically defined in MS Project.

Equipment Utilization Charts. The equipment utilization chart displays the utilization of the various equipment items as a function of time for a single or multiple batches (see figure below - three consecutive batches). White space between bars represents idle time. The equipment with the least idle time between consecutive batches (R-103 in this case) is the time (or scheduling) bottleneck that determines the maximum number of batches per year.
A similar chart is available for clean-in-place (CIP) skid utilization. CIP skids are common time bottlenecks in the biotech and food industries.

Tracking of Resources
Resources (e.g., demand for labor, raw materials, heating and cooling utilities, power) are common bottlenecks in batch manufacturing. SuperPro Designer calculates and displays the demand for such resources as a function of time. Furthermore, for resources that can be stored, it keeps track of their inventories.
For instance, the figure below displays the demand for WFI (water for injection) for three consecutive batches of a biopharmaceutical process. The red lines represent instantaneous demand as a function of time whereas the green line represents cumulative demand and corresponds to the y-axis on the right. The blue line represents averaged demand over a one-day period (the averaging period can be adjusted by the user). Limits for instantaneous and cumulative capacities also can be displayed.

The figure below displays the labor requirement (blue lines) for four consecutive batches. The red line represents the limit (7 operators available). Notice that for short periods of time there is a need for eight operators. If that need cannot be met, then certain operations will need to be delayed to accommodate that constraint. Oftentimes, such resource constraints become time bottlenecks that determine the maximum number of batches that can be processed over a period of time.

Inventories of Resources
For resources that can be stored (e.g., raw materials), SuperPro calculates and displays their inventory. For instance, the figure below shows the inventory of WFI for a single batch. The blue line (the values correspond to the y-axis on the right-hand-side) represents the level of WFI in its storage tank. The red lines represents the limits of the tank (full and empty), and the gray lines (the values correspond to the y-axis on the left-hand-side) represent the operation of the still that generates the WFI. The still is turned on when the liquid level in the storage tank drops below 35% and it is turned off when it exceeds 90%. The still may also operate based on fixed on and off intervals.
During the design of a new biopharmaceutical facility, this utility of SuperPro is very useful in sizing the WFI still and the storage tank. During manufacturing, this feature can be used to make sure that changes in scheduling and introduction of new products do not lead to shortages of WFI and other resources.

Other Important Features of SuperPro / EnviroPro Include